Performance Highlights

Performance Highlights

Global Sales Results

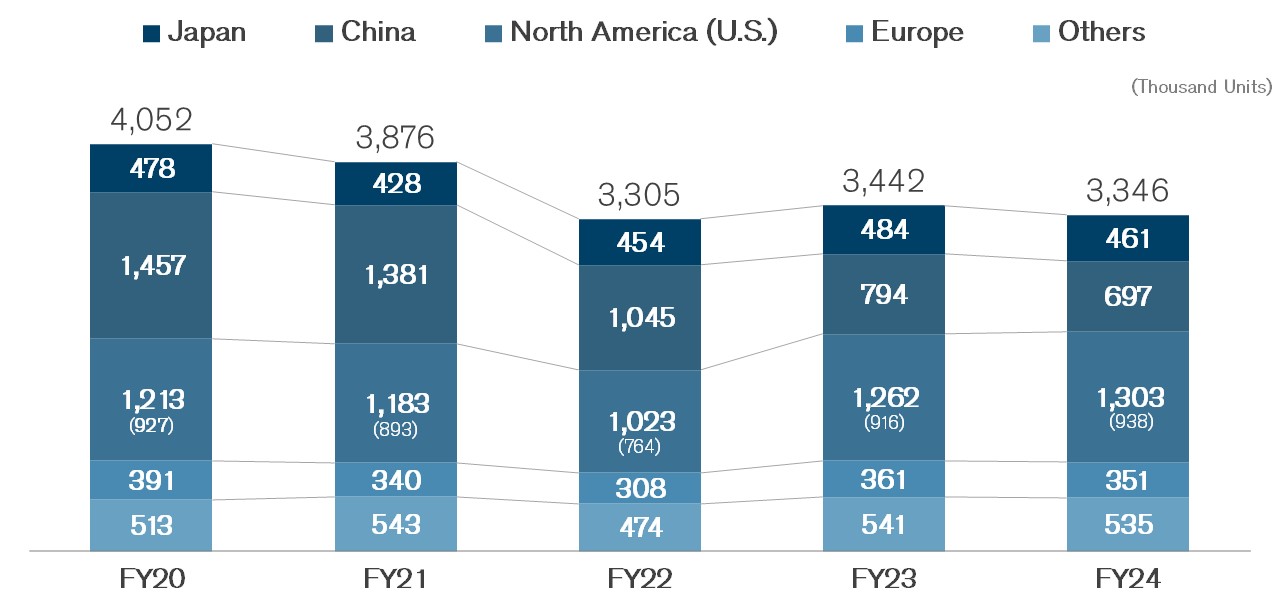
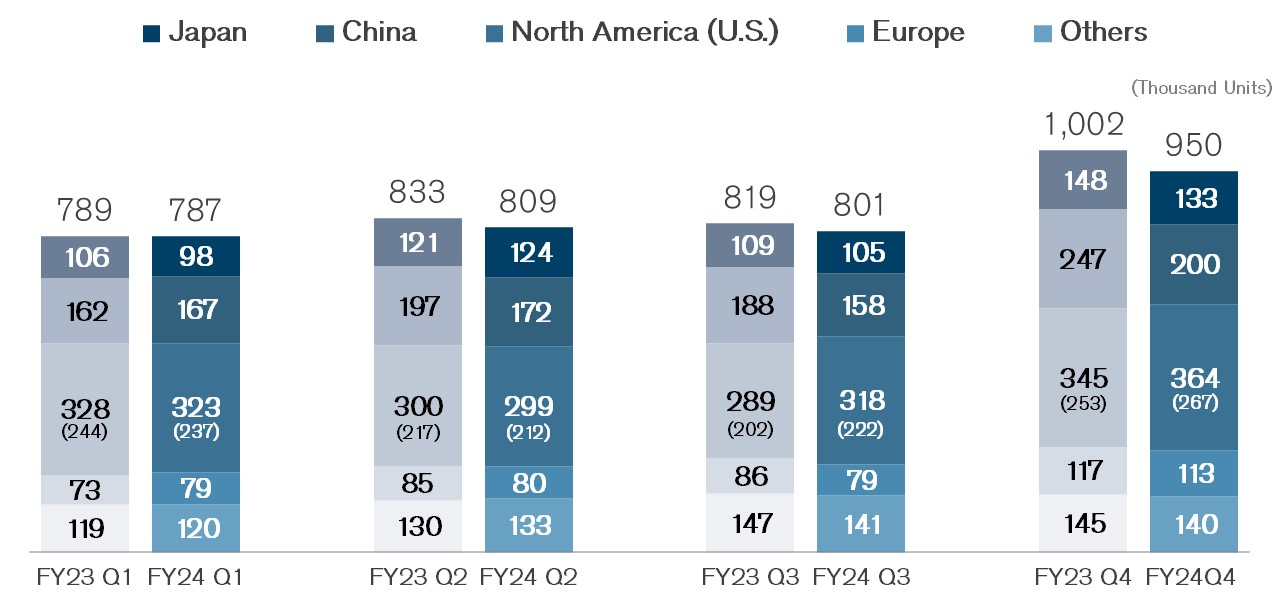
Nissan's global sales volume in the fiscal year 2023 increased 4.1% from a year earlier to 3.44 million units, supported by satisfactory sales in Japan, North America, and various regions, including Europe (excluding China).
Here are the sales results and the top three best-selling models in our four major markets (Japan, China, the U.S., and Europe) in the fiscal year 2023.

Global
Sales
(Unit: thousand)

Global Sales

Japan

Total Industry Volume in Japan increased 3.2% from a year earlier to 4.53 million vehicles. Nissan's regional sales rose by 6.5% year-on-year to 484 thousand vehicles.

Top 3 best-selling models

FY on a fiscal-year basis (April-March)

Total Sales: 484 thousand vehicles

FY2023

Total Sales: 454 thousand vehicles

FY2022

Total Sales: 428 thousand vehicles

FY2021

China

Total Industry Volume in China increased 6.0% from a year earlier to 24.75 million vehicles. Nissan's regional sales fell by 24.1% year-on-year to 794 thousand vehicles.

Top 3 best-selling models

FY on a fiscal-year basis (January-December)

Total Sales: 794 thousand vehicles

FY2023

Total Sales: 1,045 thousand vehicles

FY2022

Total Sales: 1,381 thousand vehicles

FY2021

U.S.

Total Industry Volume in the U.S. decreased 12.4% from a year earlier to 15.68 million vehicles. Nissan's regional sales fell by 19.8% year-on-year to 916 thousand vehicles.

Top 3 best-selling models

FY on a fiscal-year basis (April-March)

Total Sales: 916 thousand vehicles

FY2023

Total Sales: 764 thousand vehicles

*Including Rogue Sport

FY2022

Total Sales: 893 thousand vehicles

FY2021

Europe

Total Industry Volume in Europe increased 12.3% from a year earlier to 16.35 million vehicles. Nissan's regional sales increased by 17.2% year-on-year to 361 thousand vehicles.

Top 3 best-selling models

FY on a fiscal-year basis (April-March)

Total Sales: 361 thousand vehicles

FY2023

Total Sales: 308 thousand vehicles *

*Including Russia

FY2022

Total Sales: 340 thousand vehicles *

*Including Russia

FY2021